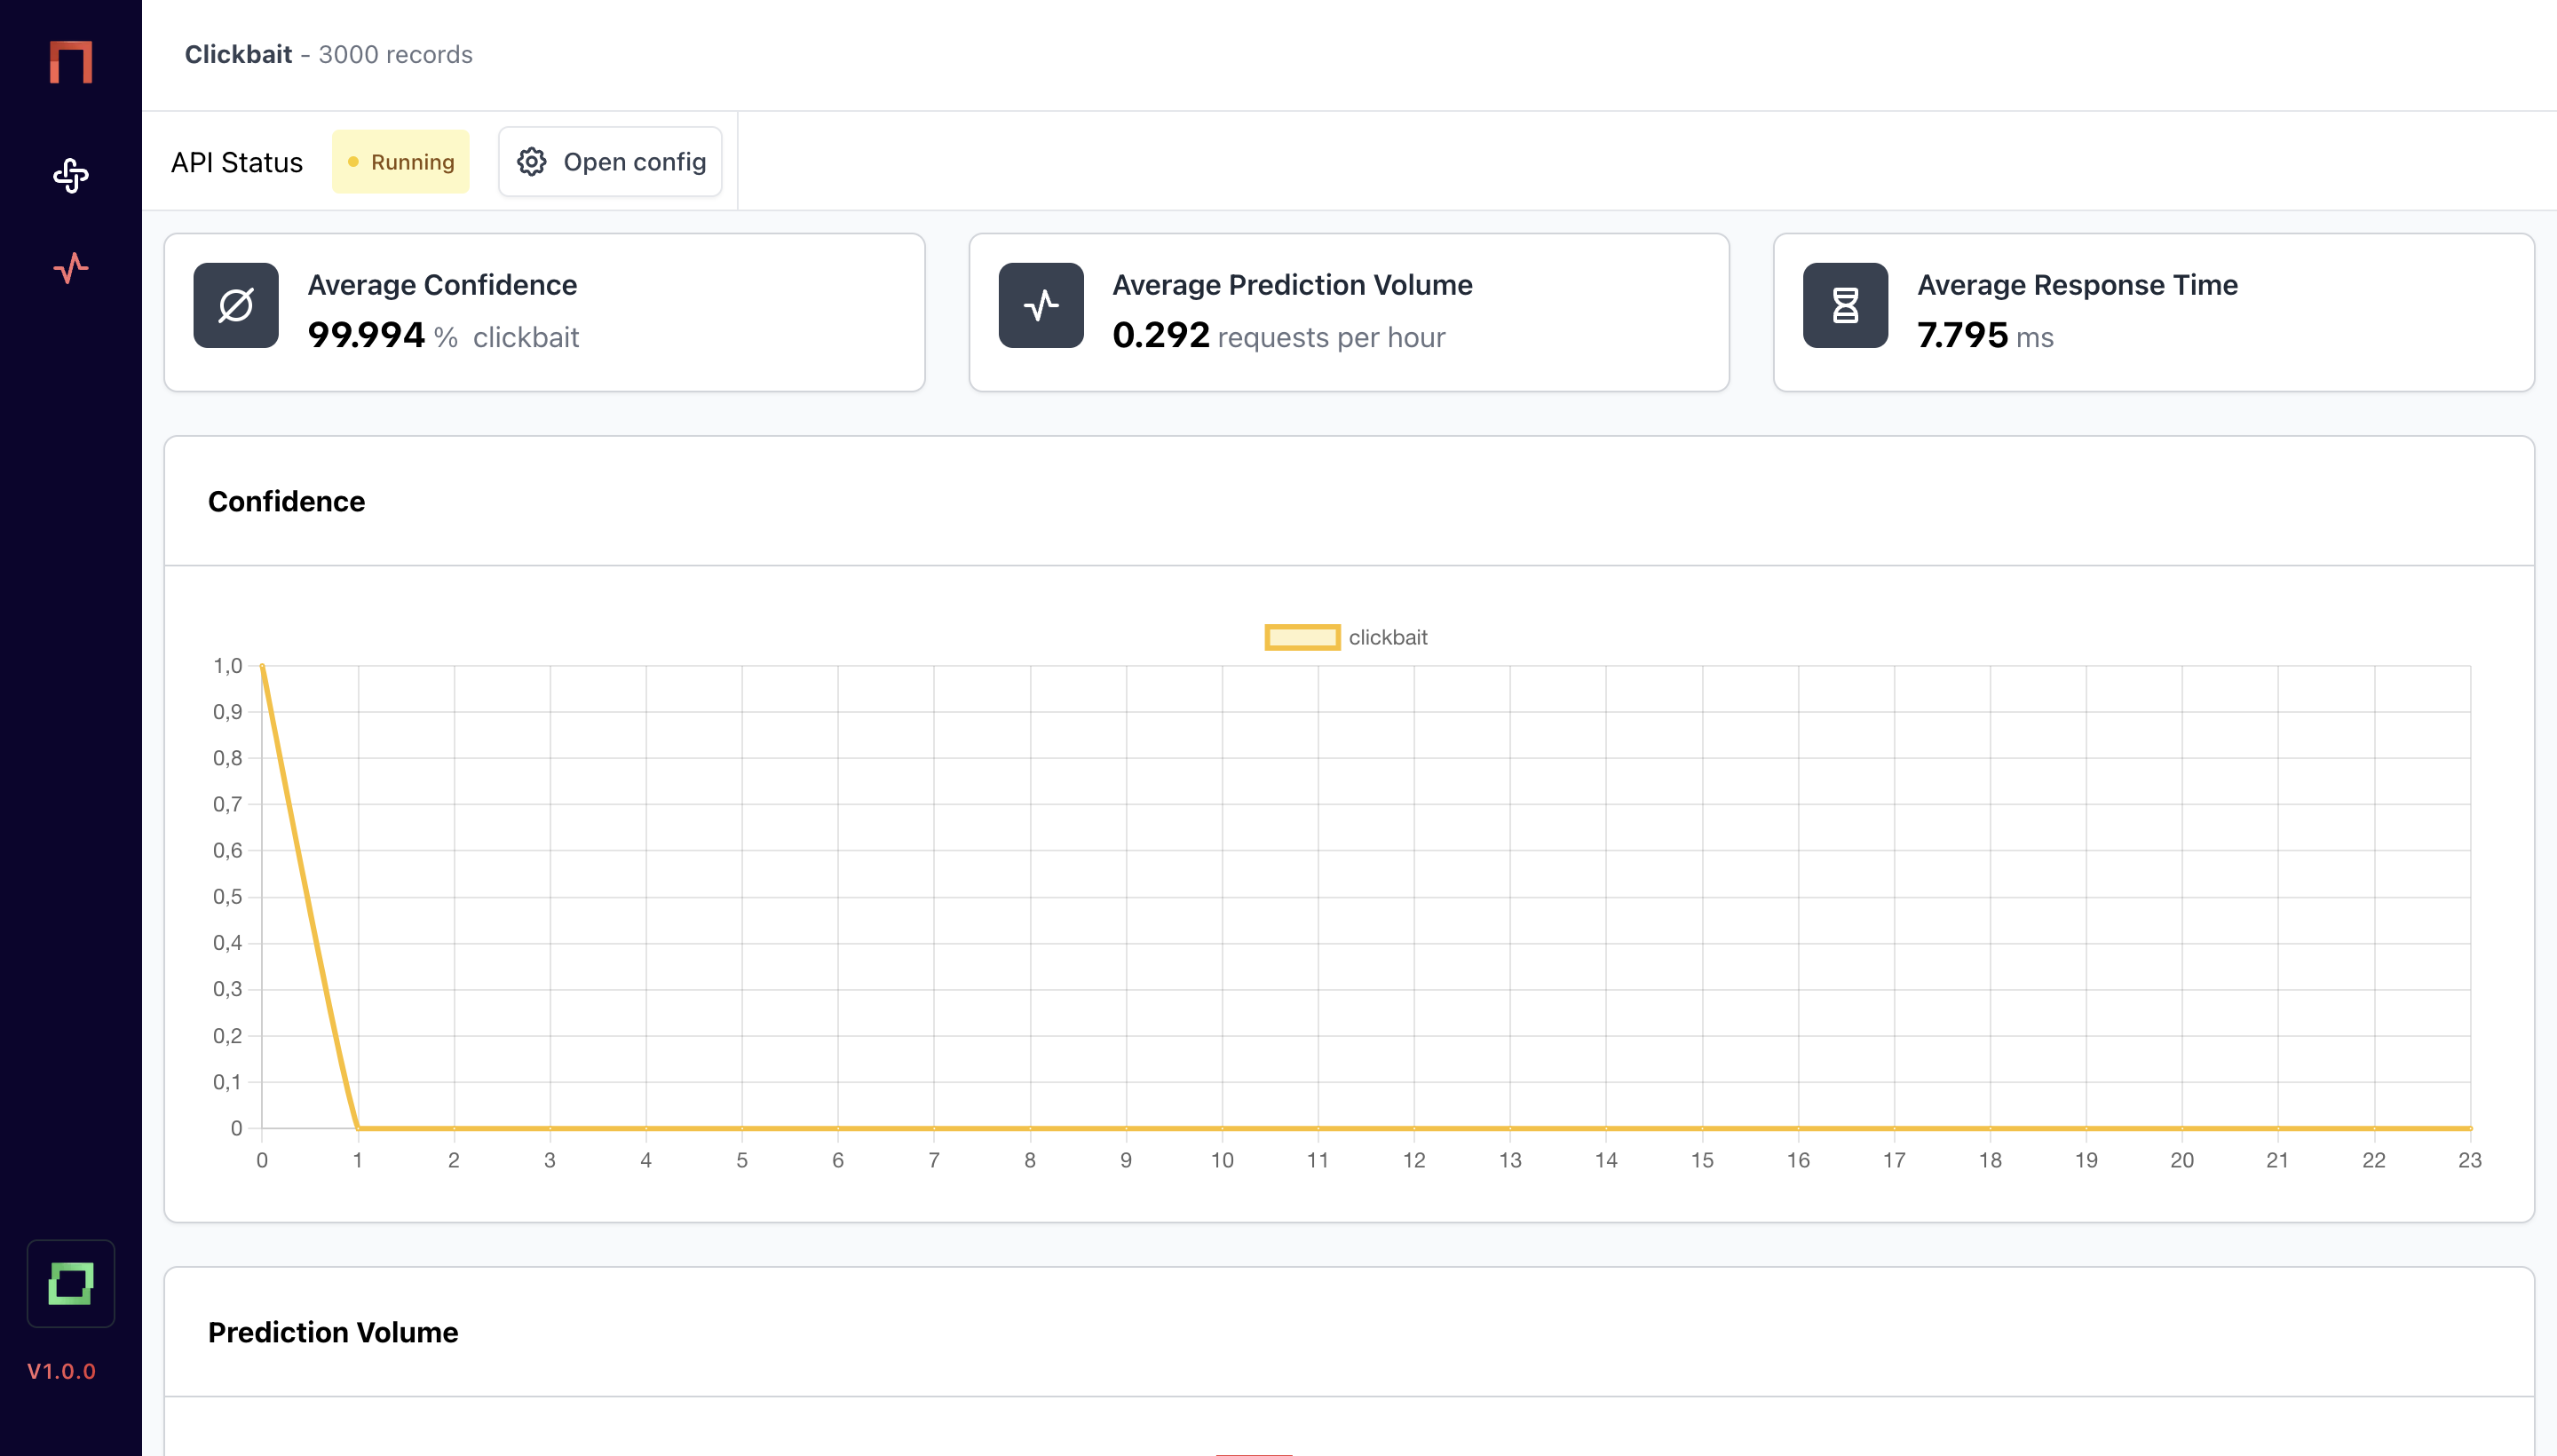
Monitoring
gates comes with a simple monitoring overview for you to monitor basic metrics.
The y-axis is the metric, the x-axis indicates the last 24 hours (i.e. most-leftern value is now, then 1 hour before etc.)
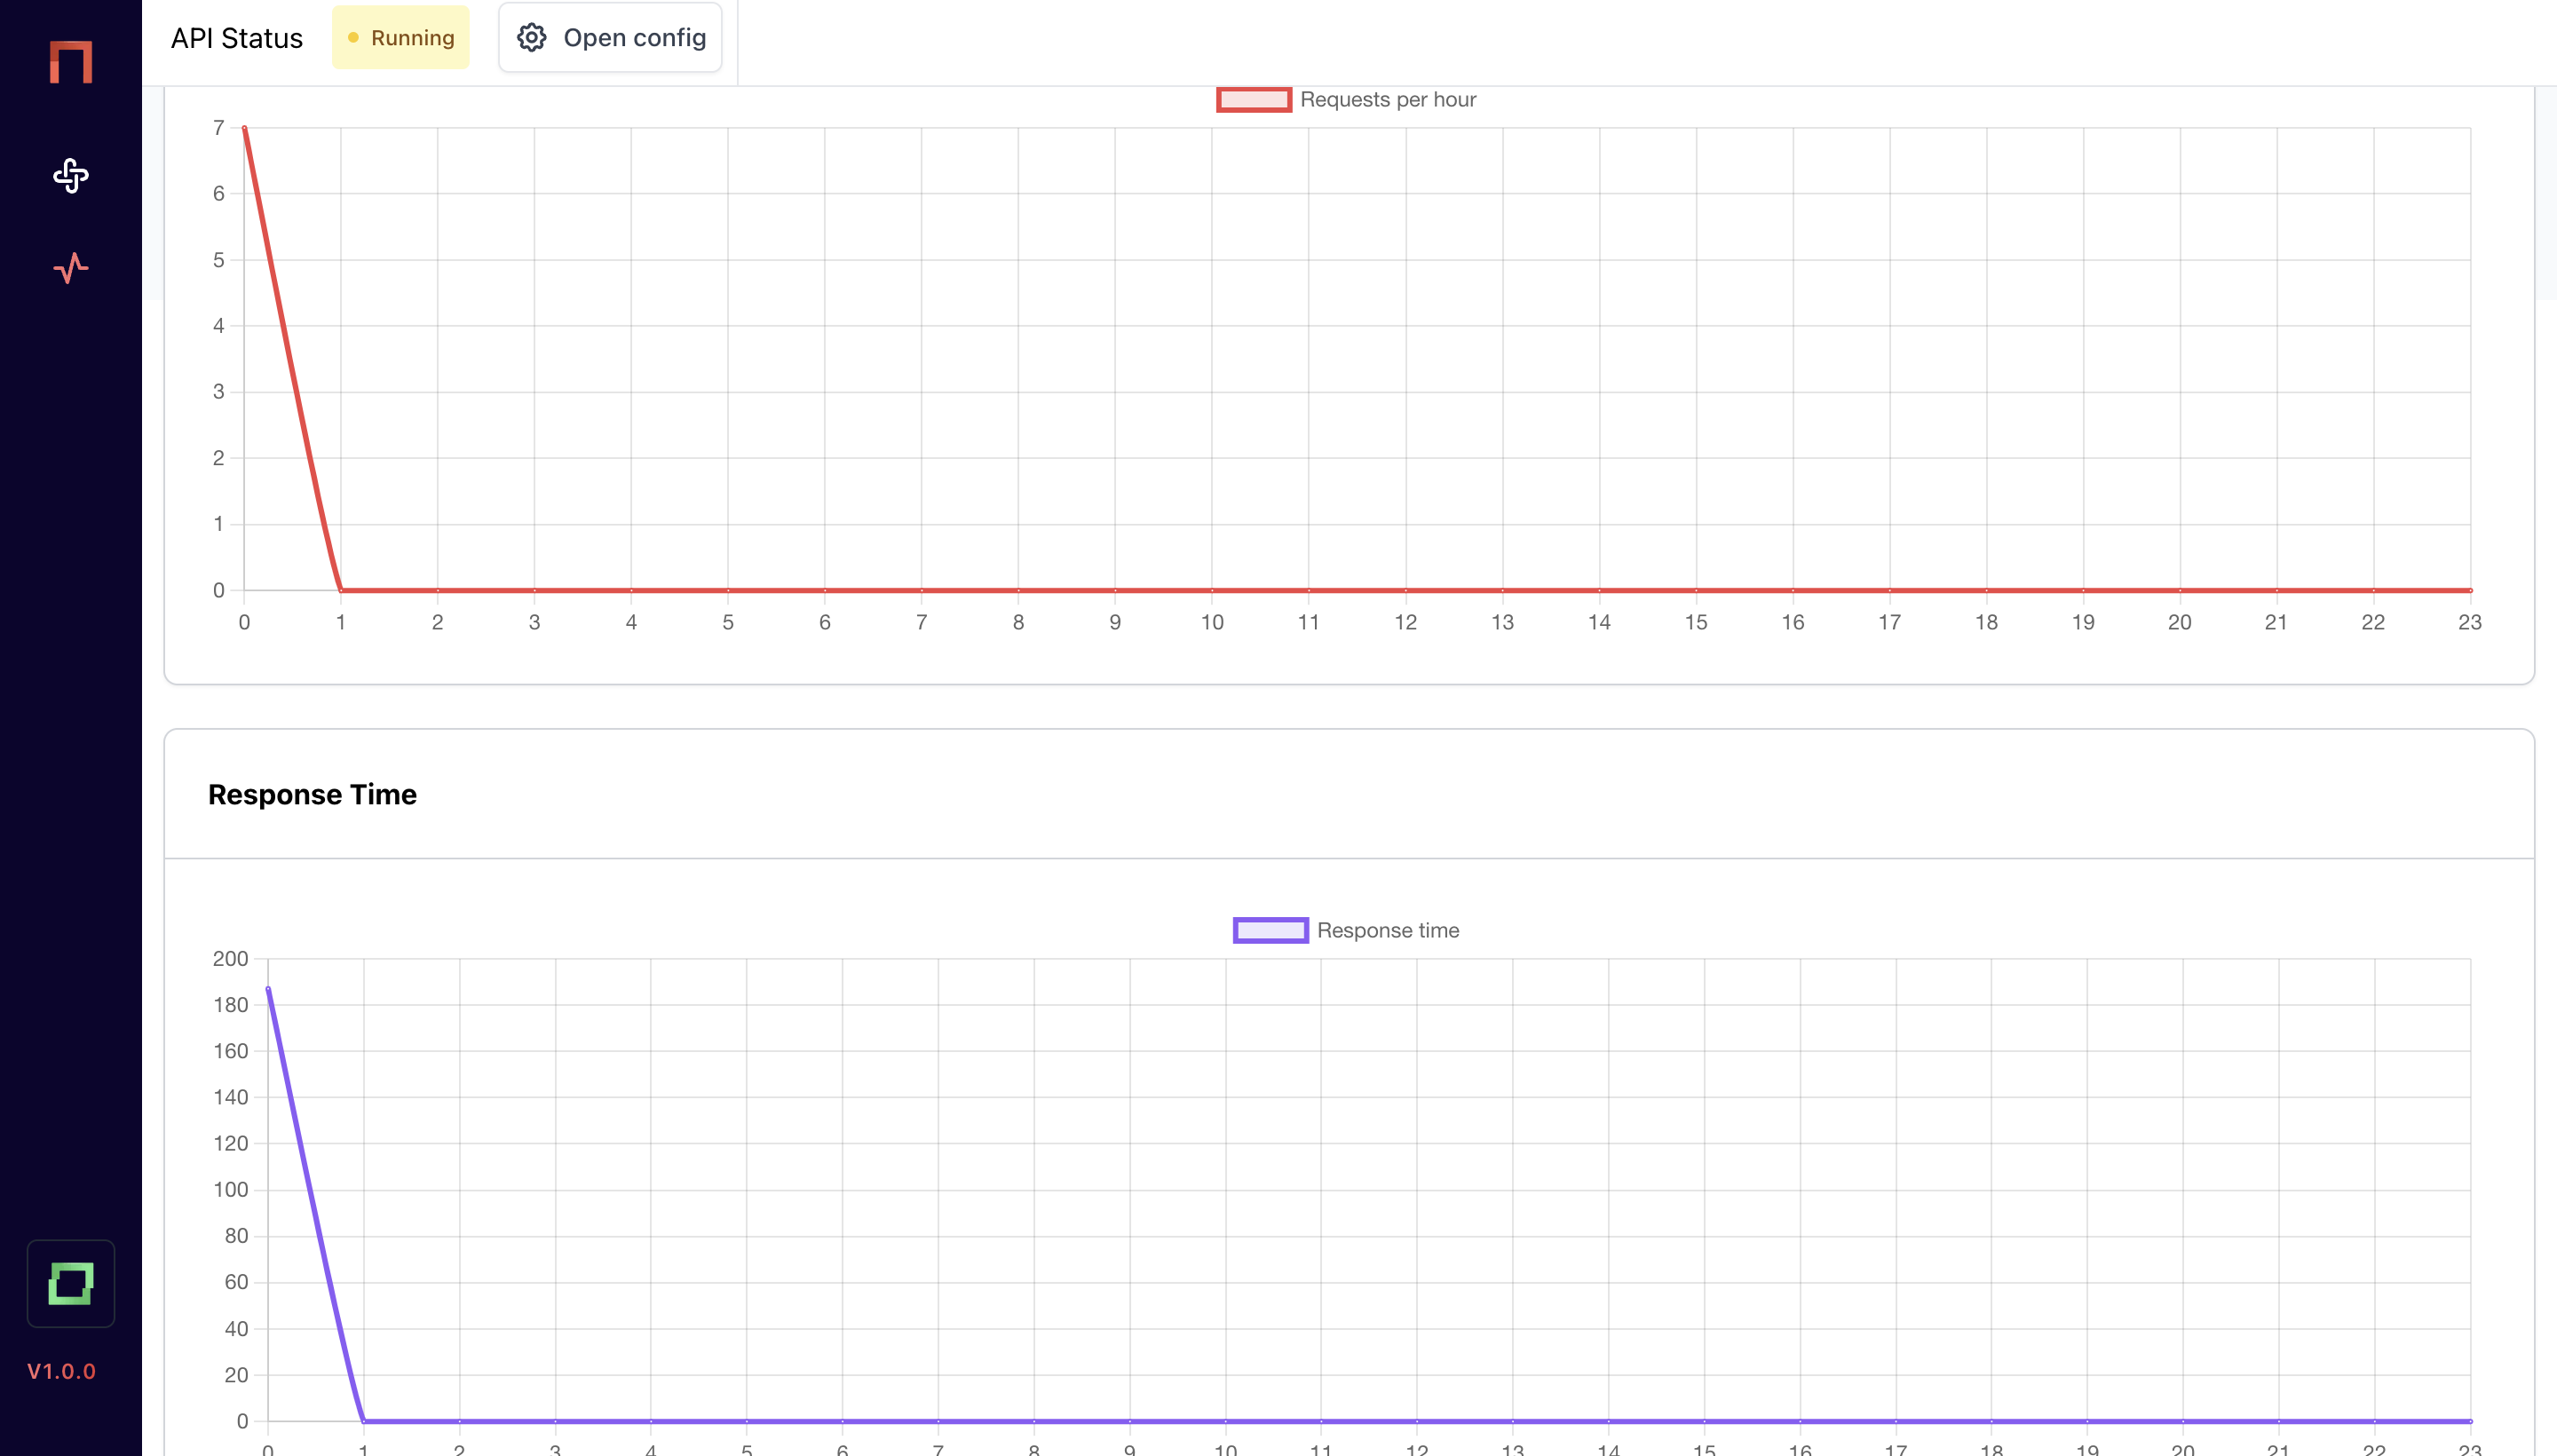

gates comes with a simple monitoring overview for you to monitor basic metrics.
The y-axis is the metric, the x-axis indicates the last 24 hours (i.e. most-leftern value is now, then 1 hour before etc.)