
Quickstart
refinery is awesome and full of complex features, which makes it such a great tool. That also comes with the downside that completely new users might feel overwhelmed at first. This walkthrough aims at eliminating this initial feeling! We will create a project with easy-to-understand data which we will use to explain most of the important features of refinery. In the end, you will have a labeled dataset ready for prototyping models and a good understanding of refinery itself!
If you have any questions, would like a personal onboarding, or just want to leave feedback, we are highly available on our community Discord server. Drop by and we will be happy to help!
For this walkthrough you will need:
- (if you use the open-source, self-hosted version:) an already installed version of refinery
- between 15-30 minutes of time
Set up the clickbait example project
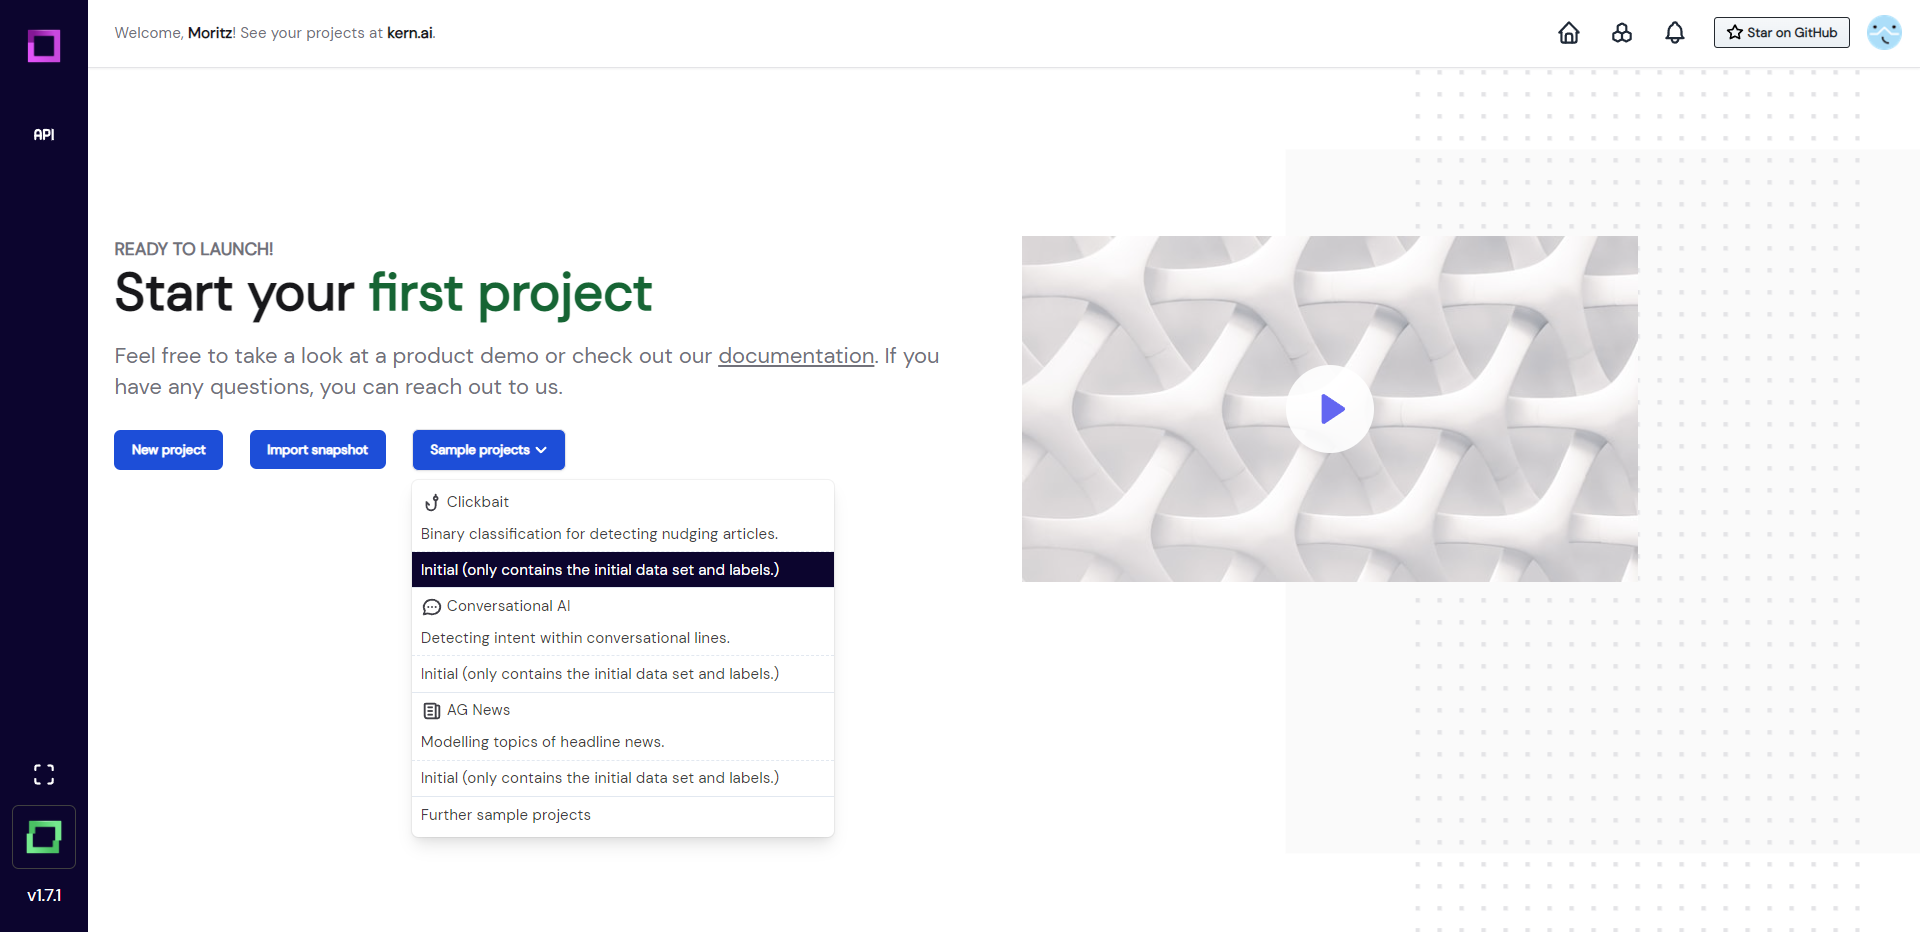
After following the installation guide, you should know the refinery home page. Here we will now create a sample project that comes with two things: a pre-loaded dataset and two labeling tasks. But more on that in a second, first we have to create the project. Click on "sample projects" and select "initial" directly below the "clickbait" sample use case (see 1). We want to load up the initial version because we want to simulate starting from scratch.
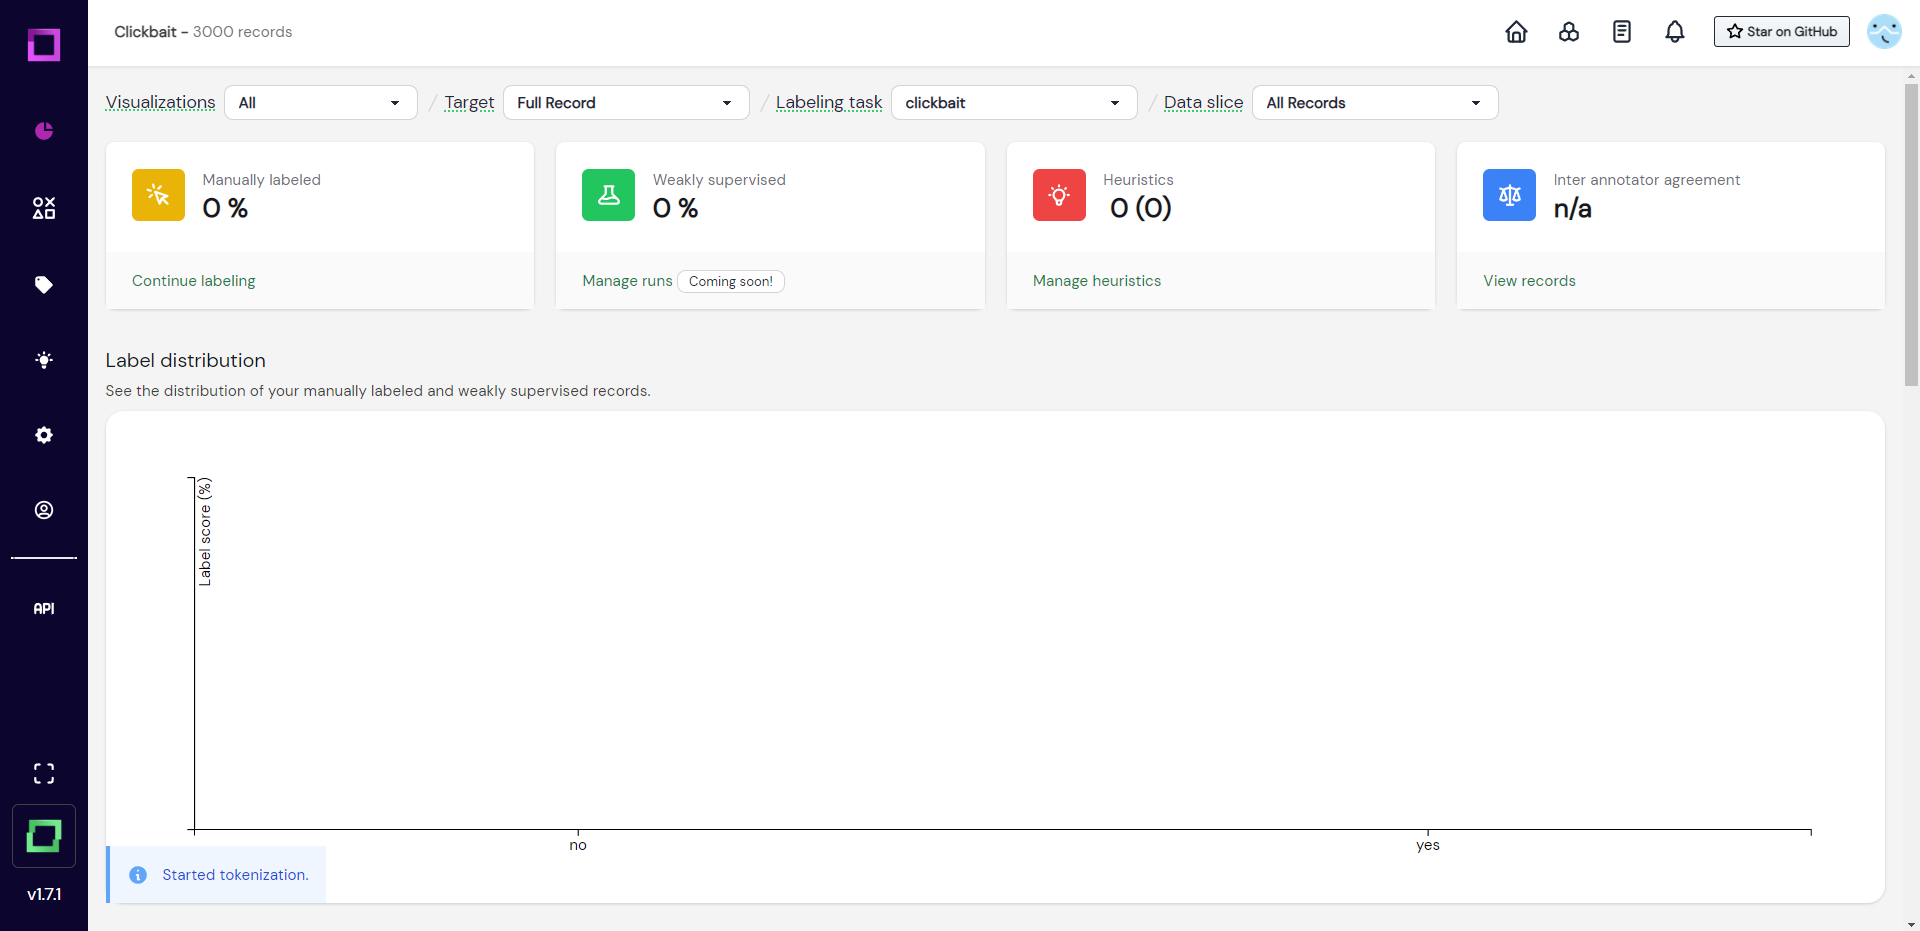
After creation, you will be redirected to the first page of your project - the overview page (see Fig. 2). Here you can monitor your labeling progress and follow aggregated stats. As we haven't done anything in the project yet, this will be rather empty. Let's go ahead and inspect the data next!
Inspecting the data
In order to see what data is available to us, we will head over to the second page of refinery: the data browser. For that, we select the second icon in the navigation bar on the left (hover over the icons to inspect their names). As you can see in Fig. 3, the data is rather simple: a running_id and a single headline for each record.
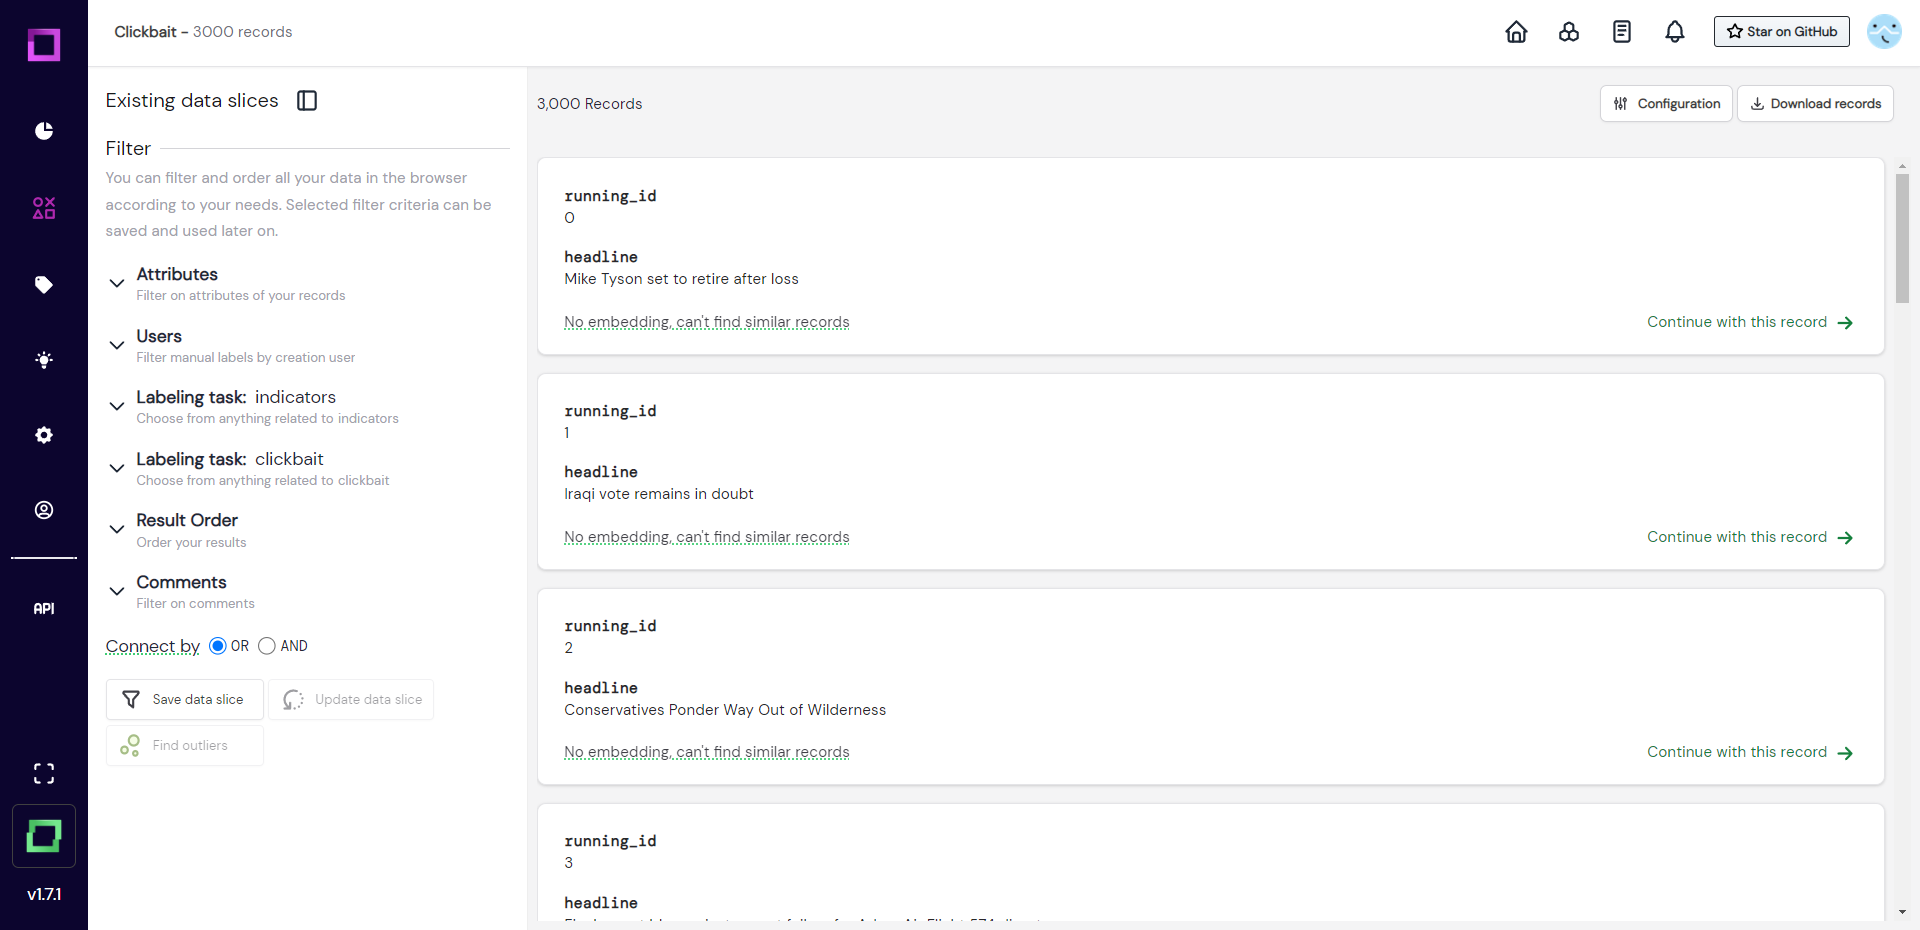
The data seems to be properly imported without any corruptions or artifacts, which should always be the first sanity check when creating a new project. There are two things we notice about this page, though. The first thing is that it says "no embedding" under every record. The second thing is that there are two filter settings on the left side that refer to labeling tasks. Let us look at both of those things in more detail on the settings page (gear icon in the navigation bar).
Optional challenge: find out if there is any other headline in the data mentioning Mike Tyson.
Understanding the project settings
The project settings page has three important components: the data schema, embeddings, and labeling tasks. Let us first understand the data schema.
Data schema
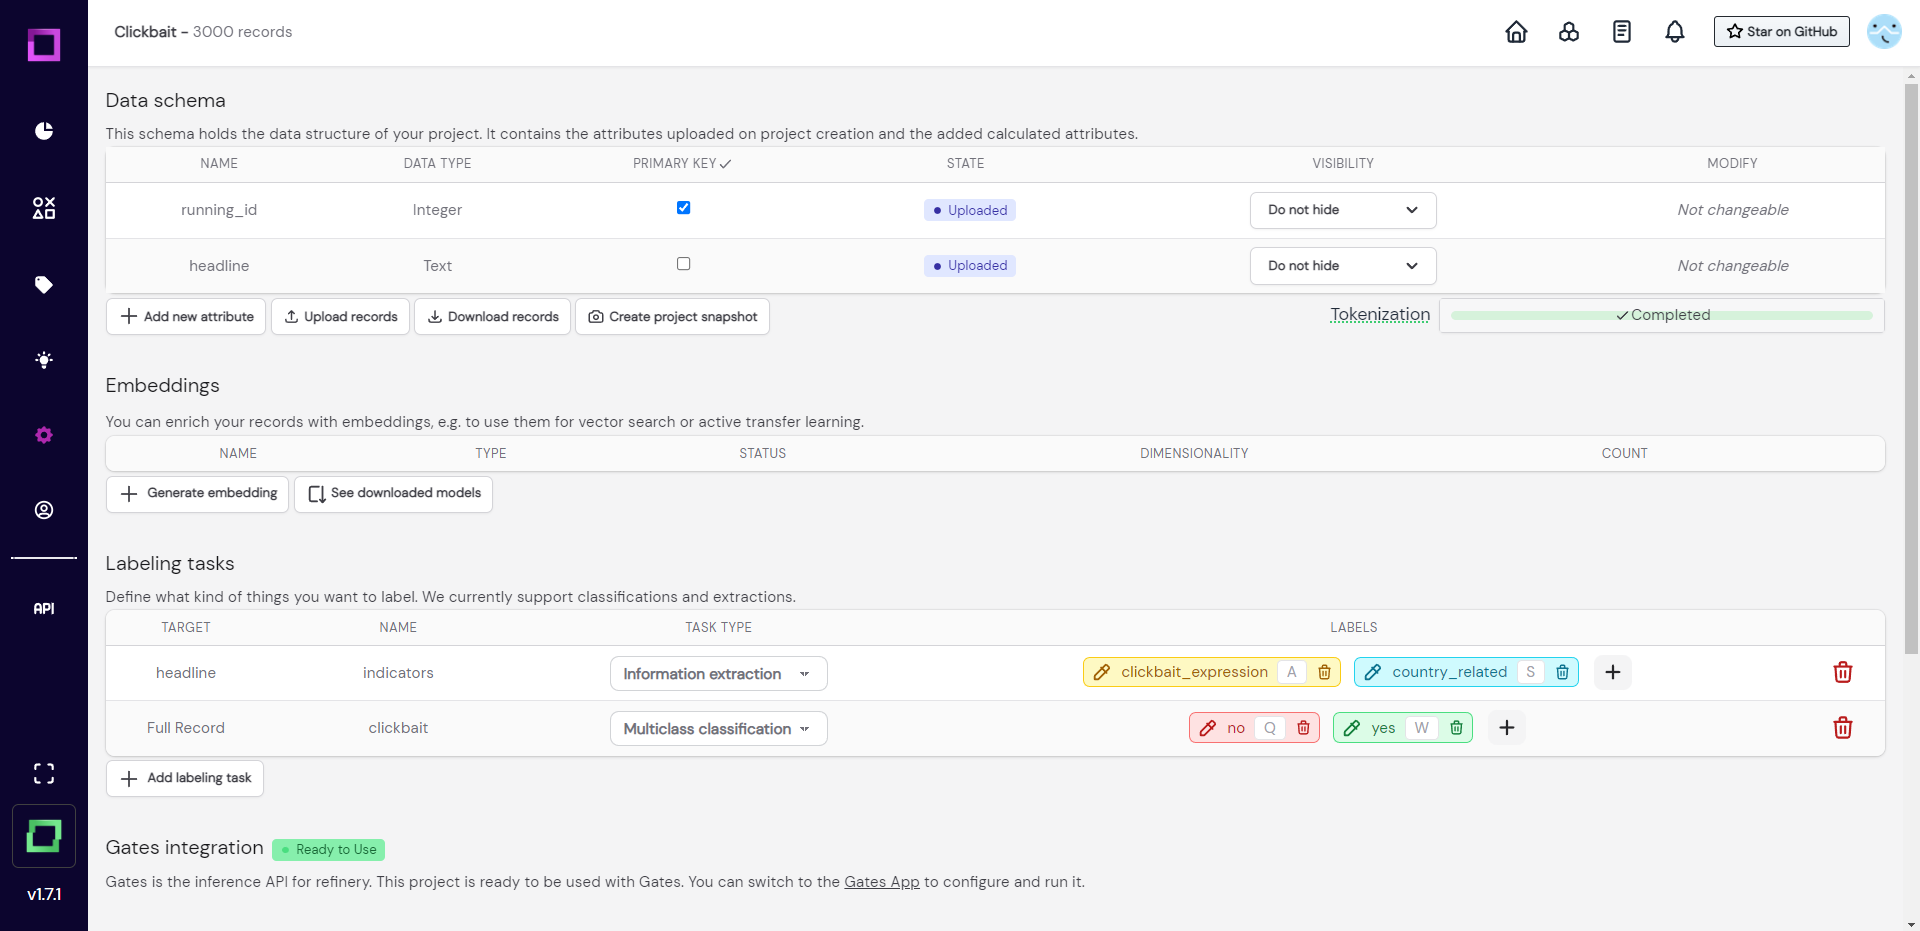
The data schema (Fig. 4) depicts all the attributes of your data with their respective data type. This is the place where you can upload more records that fulfill this data schema, download your records and project, or even add new attributes by writing them as python functions (really powerful and fun). We won't do any of this for the time being, so we will continue with the embeddings.
Embeddings
If you are familiar with NLP, you know that embeddings are a vector representation of your text data carrying semantic information. This embedding is a requirement for many features of refinery, like neural search, active learners, zero-shot classification.
In order to use those features, we will now create an attribute-level embedding of our headline attribute with the distilbert-base-uncased model from huggingface.
The notifications in the bottom left corner signal us that the process of encoding has finished. Refinery reduces the dimensionality of your embeddings automatically to save disk space (without significant performance losses). For more information about embeddings in refinery, read the dedicated section about it.
For now, all we have to know is that we added semantic vector representations of our data to our project, which unlocks many features! Let us continue with the settings page and look at the existing labeling tasks.
Labeling tasks
When you want to label something, you have to first define it as a labeling task. For example, we want to label if headlines are clickbait or not, which means we need a classification labeling task. Luckily, this project already came with two labeling tasks: one for classification, and one for information extraction (see Fig. 4 or Fig. 5). A classification task can only carry one label per record or attribute (for us it is either "yes" or "no") while an information extraction task labels individual parts of the text, just like a text marker would. That is why the extraction task is defined on an attribute (target is "headline").
You might think that we don't need the extraction task because we just want to classify clickbait articles and not do any Named Entity Recognition on this data, but extraction tasks come with a neat feature that we will make use of later. They are directly linked to lookup lists, which are collections of terms that are automatically generated when we label.
One thing bothers us though, and that is the inexpressiveness of those label names "yes" and "no". Let us change those labels to better reflect what they represent. Refinery is built to handle changing requirements during the project, which is why renaming labels is possible at all times.
We are now ready to finally label some data! Let us visit the labeling suite, which is accessible by clicking the little label icon in the navigation bar on the left.
Labeling
Manual labeling is a crucial part of gathering high-quality training data, which is why we won't skip it for this quickstart. Refinery handles manual labeling in so-called "labeling sessions", which are just a sequence of 1000 records. When just clicking on the labeling icon in the navigation bar, we are presented with the first 1000 records of our project in the default order. Read more on labeling sessions on the manual labeling page of this documentation.

The labeling suite is generally really powerful because it is highly customizable to your needs. You are in complete control of the amount of information displayed on the screen, which by default looks like Fig. 7. Assigning classification labels is as easy as clicking on them (or pressing their keyboard shortcut). Extraction labels are defined on spans, which you first have to select with your mouse.
For this labeling part, we will first label a record if it is clickbait or not, and then label (if possible) the part of the headline that influenced that decision. By doing that, we are collecting more information about our decision-making, which we can use for some labeling automation in later steps. One available label for span labeling is called country_related, which we will use to indicate what parts of non-clickbait headlines refer to political events or entities, which is almost never clickbait but real news. Label about 20-30 examples (see Fig. 8) so we have some data to work with later!
Optional challenge: start a labeling session with random unlabeled data from the data browser.
Pattern discovery
Now that we have labeled a bunch of data, we already suspect certain patterns to indicate whether a headline is clickbait or not. For example, many clickbait headlines started with a number or addressed the reader directly (saying "you must" or "why you should"). If these patterns really do indicate the class of a headline, we would like to write these patterns down as labeling functions, helping us in accelerating the labeling process. But before we can do that, we have to confirm our suspicions, which we will do in the data browser, so we can head over there now by clicking on its icon in the navigation bar!
The first pattern we want to look at is if most of the records starting with a number are actually clickbait. For that, we open the filtering options for "result order" and order our records by the headline (ascending, see Fig. 9). This works just like the ordering in your file explorer, which has all special characters coming first, then numbers, then letters.
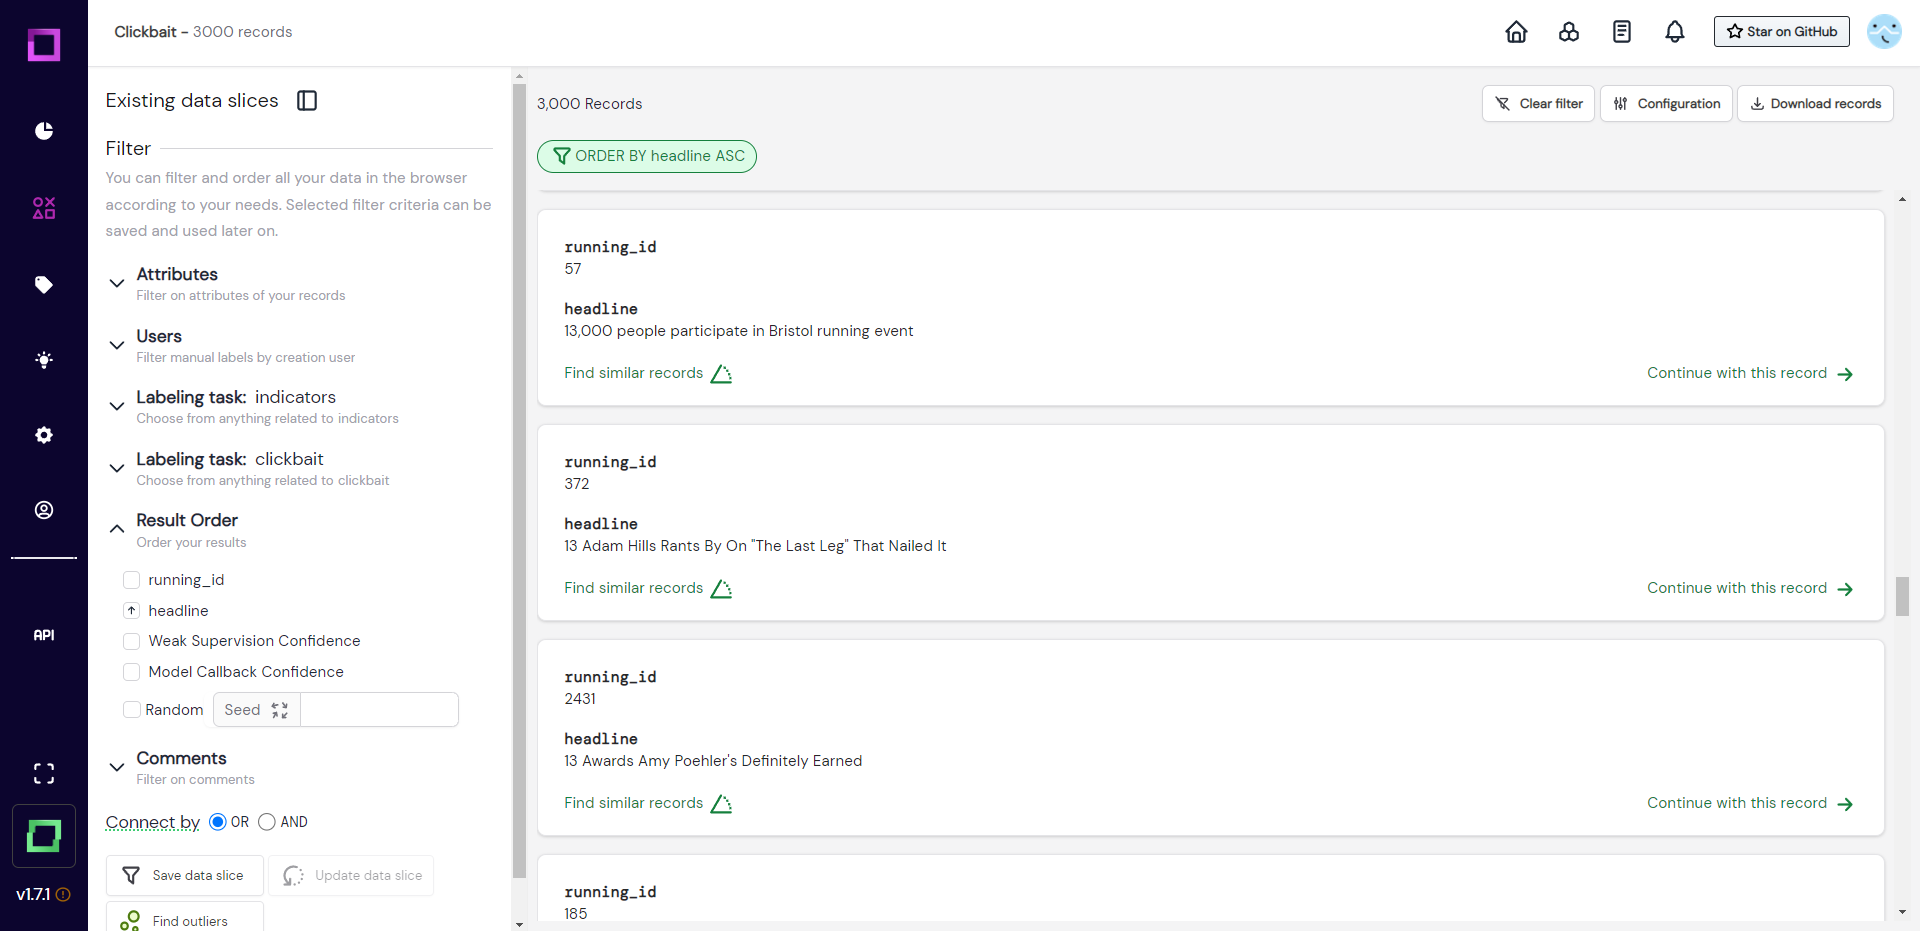
When scrolling through these records, we confirm our suspicion that most of these are clickbait headlines. These patterns will not be used as a single source of truth and more like a heuristic, which is why they don't have to be perfect!
The next pattern we want you to validate yourself! For that, clear the existing filter by clicking on the "clear filter" button in the top right area of the data browser. After that, find a way to filter your data according to the headline attribute containing words that are addressing a person directly, e.g. "you" or "your". If you need some help, the data management documentation should contain the information you want! In case you don't want to or cannot solve this task, just continue with the quickstart.
Optional challenge: label a few records that are similar to the one where the running_id is six (hint: use refinery's neural search feature).
Writing our first labeling function
You probably gave refinery a shot because you heard it saves you a lot of time by leveraging modern labeling techniques that go way beyond manual labeling. We're just about to do exactly that! Refinery allows you to leverage heuristics, which are imperfect label predictors that are, in the end, aggregated to a single label with a process called weak supervision.
The best heuristic to explicitly transfer domain knowledge to the system is a labeling function. A labeling function lets you make a prediction for your data with Python code. Let's write a labeling function that captures the patterns we discovered in the earlier section.
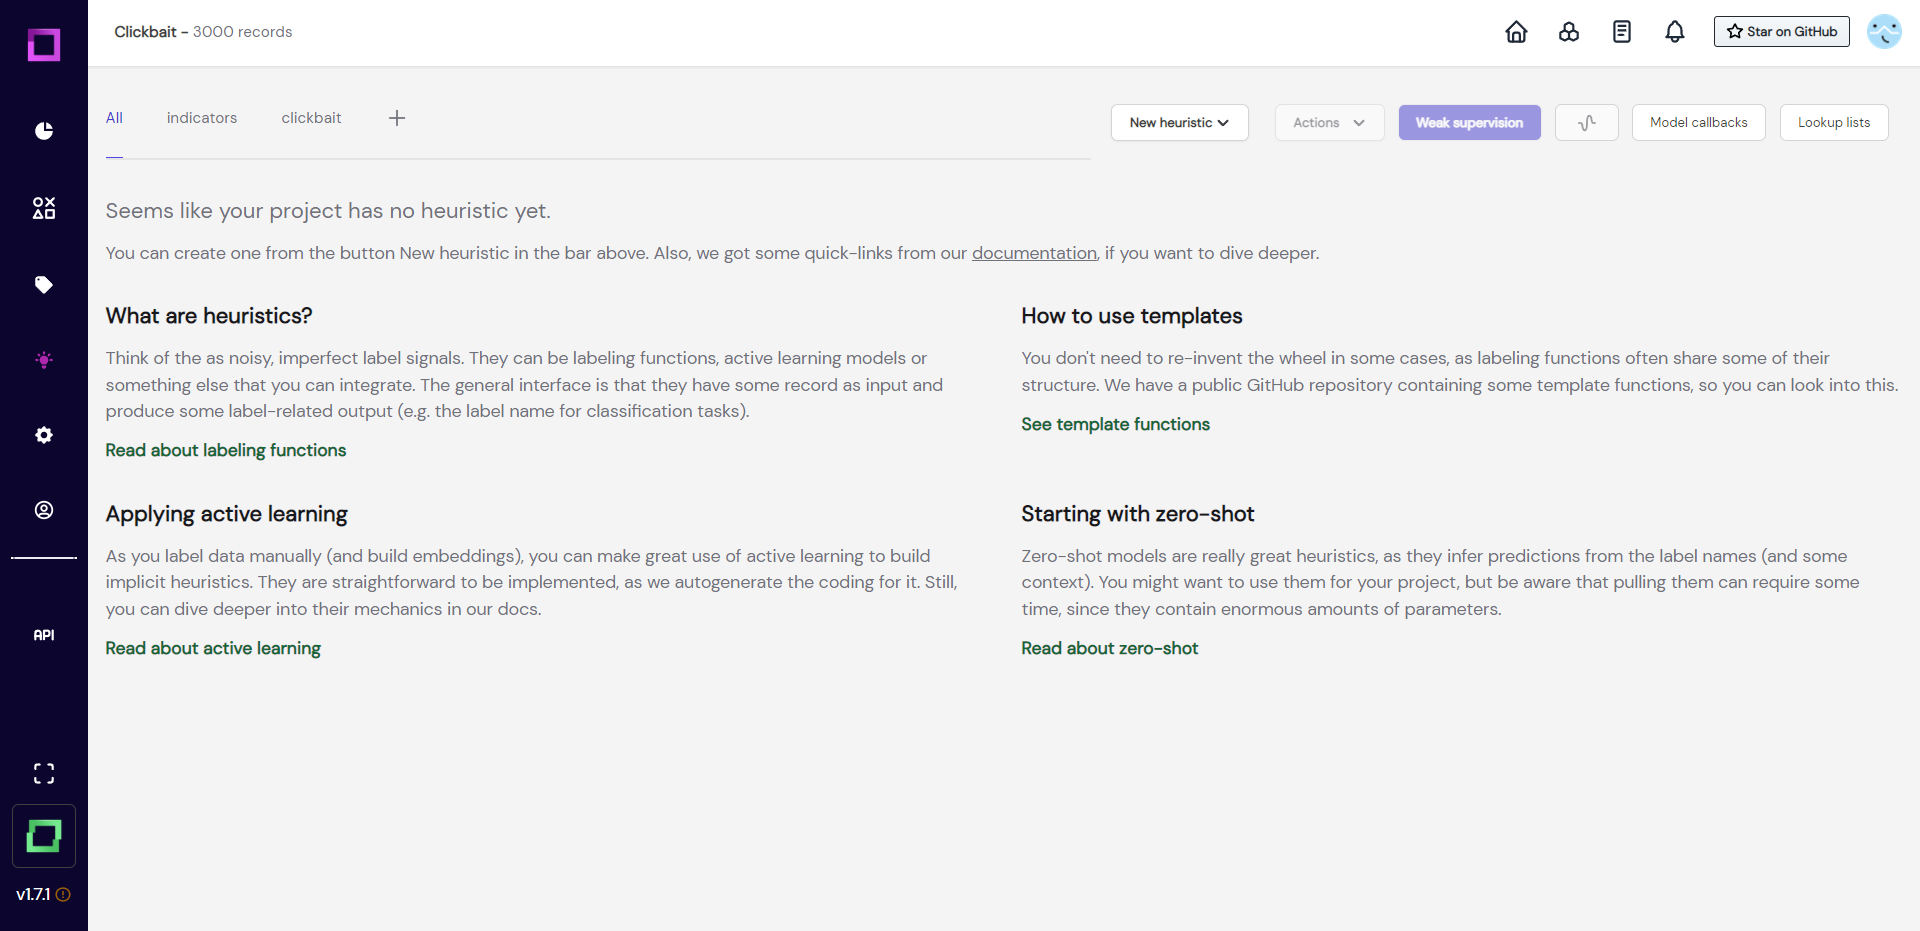
Head over to the heuristics overview page by clicking on the light bulb icon in the navigation bar (see Fig. 10). After that, select "new heuristic" and "labeling function" at the top of the screen. Make sure to select the right labeling task (clickbait).
After creation (see Fig. 11), you will be redirected to the labeling function details page, where we will configure and code the function. If you're wondering what this "search in bricks" means, bricks is an open-source NLP content library maintained by us, which has many common NLP tasks pre-coded for you to choose from. If you're curious, take a look at bricks and the bricks integration page of this documentation.
For this quickstart, we will start from scratch. Let us write a function that splits the headline into a list of words and looks if the first word is a number. If it is, we are going to return the label clickbait. If it is not, we cannot really make a prediction and don't return anything.
Copy the following code and paste it into the code editor of the labeling function details page:
def starts_with_digit(record): headline = record["headline"].text
  headline_as_list = headline.split(" ") if(headline_as_list[0].isnumeric()):
  return "clickbait"
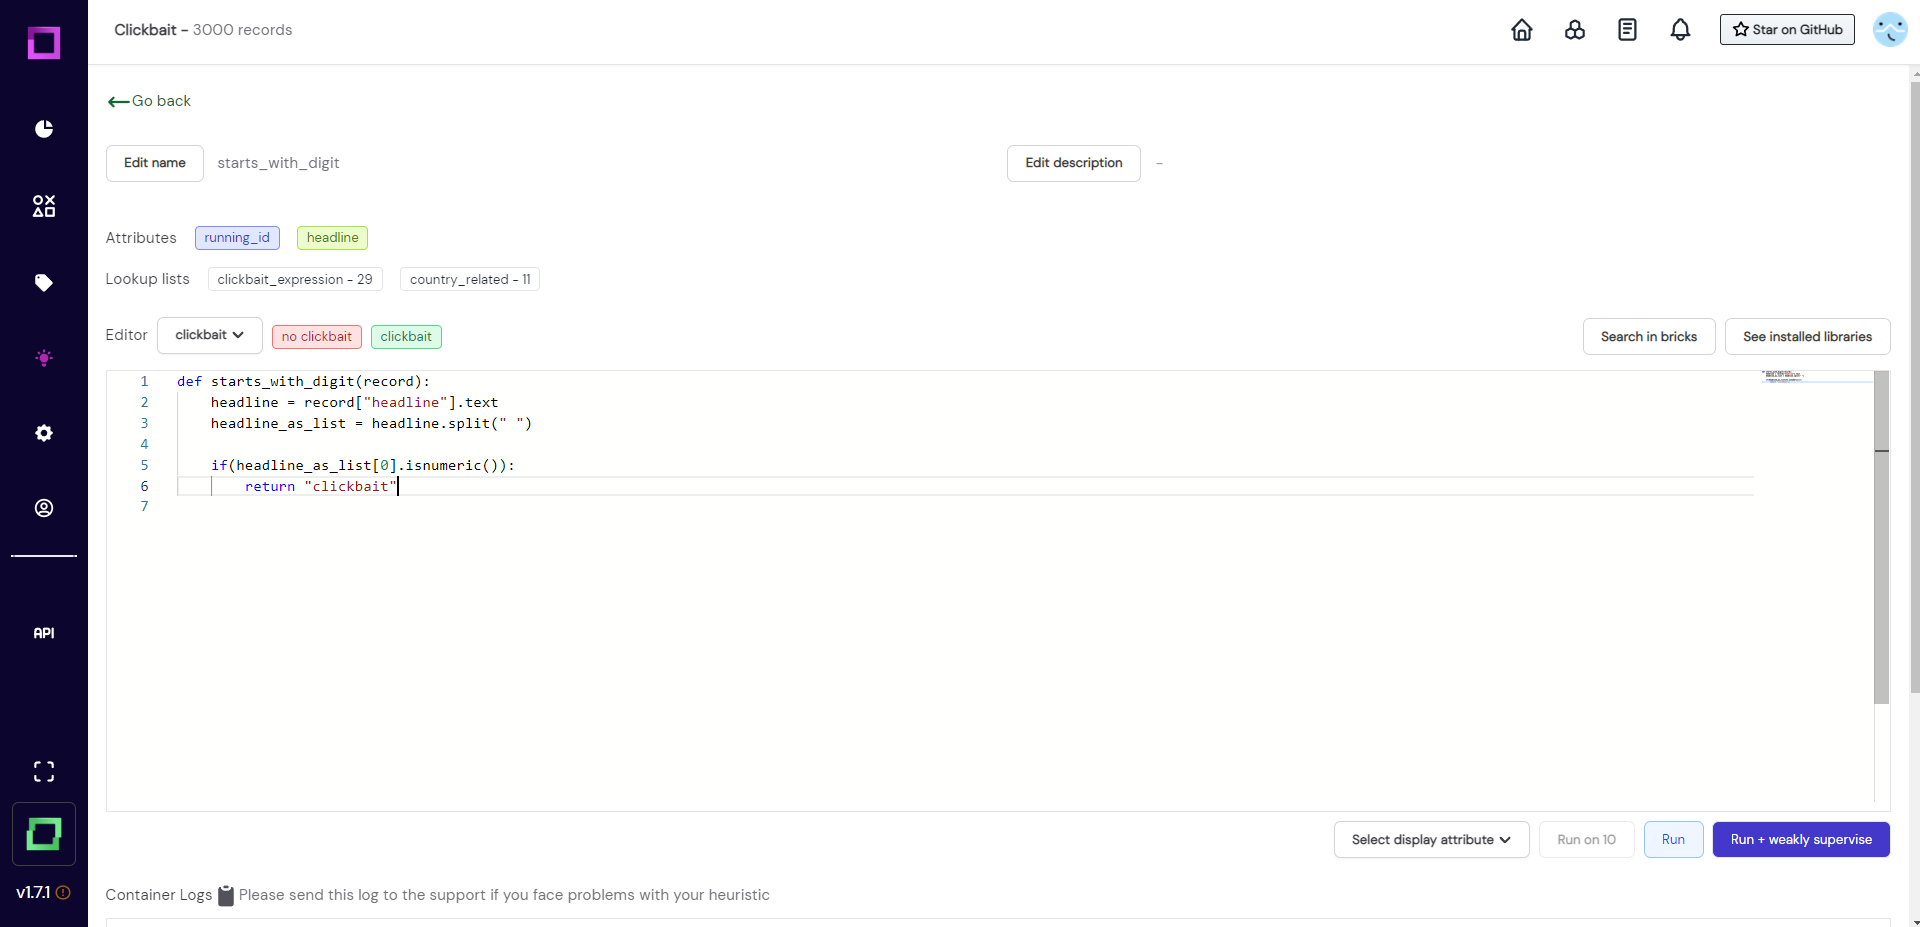
After we have written the function, we are going to validate that it works as intended without any bugs by running it on a few examples. For that, we select the headline attribute in the selection on the bottom right and press the "Run on 10" button.
We then scroll down to observe the results. As you can see in Fig. 13, the first "Run on 10" yielded no prediction as no record started with a number. We just reran it to select another 10 random records, which returned some true positives. As we gained confidence in this function, we will now run it on all records! For that, just press the "Run" button, which is right next to the "Run on 10" button that we just used.
Optional: copy the code of starts_with_digit over to the record IDE in order to test the functionality on single records.
Leveraging lookup lists
Remember that we labeled individual spans for the information extraction task? This effort will now come in handy as we will integrate the automatically created lookup lists into labeling functions that will return a label if words on that list appear in the headline.
For that, we will first inspect the lookup lists. Let us go back to the heuristic overview page and click on the "lookup lists" button on the top right (see Fig. 14).
These lists are not overly crowded at the moment, but we can still use them in labeling functions. The good part: with every label we assign, we will keep filling these lists with useful terms to determine the class of a record.
Let us write two new functions, one for each class. Fig. 15 shows how to do it for the no clickbaitclass, you can do the other one by yourself! You can take the same code and just exchange the imported list to clickbait_expression, the name of the function to lookup_clickbait, and the returned label to clickbait. Make sure to select the correct labeling task clickbait!
from knowledge import country_related

def lookup_not_clickbait(record):
for term in country_related:
if(term.lower() in record["headline"].text.lower()):
return "no clickbait"
Leveraging embeddings with active learners
Remember that we added distilbert-base-uncased embeddings to our project at the beginning? Well, these embeddings contain a lot of information from powerful pre-trained transformer models. It would be a shame if we would not use this to our advantage!
That is why we will now create a new heuristic: the active learner. The active learner is a simple machine learning model that learns on your already manually labeled reference data and then makes predictions on the rest of the data. The model can be very simple because most of the heavy lifting has already been done by the powerful transformer that encoded our texts.
To add an active learner (see Fig. 16), we just create it similar to the labeling function. Fill in the required information during creation and all the code will be pre-generated for you!
The code that is automatically generated should suffice in 80% of cases. While the structure of this code must stay the same, you could exchange modules of it, e.g. change the classifier from a LogisticRegression to a DecisionTree, exchange the embedding to a better one, or tune the min_confidence parameter. Look at the active learner documentation for more information on this!
We will now reap what we've sown and combine the information of all heuristics into a single label.
Weak supervision
As we previously mentioned, weak supervision combines all the information of the selected heuristics into a single label. The quality of this label will usually be pretty good, but still is bound to the first law of machine learning: garbage in, garbage out.
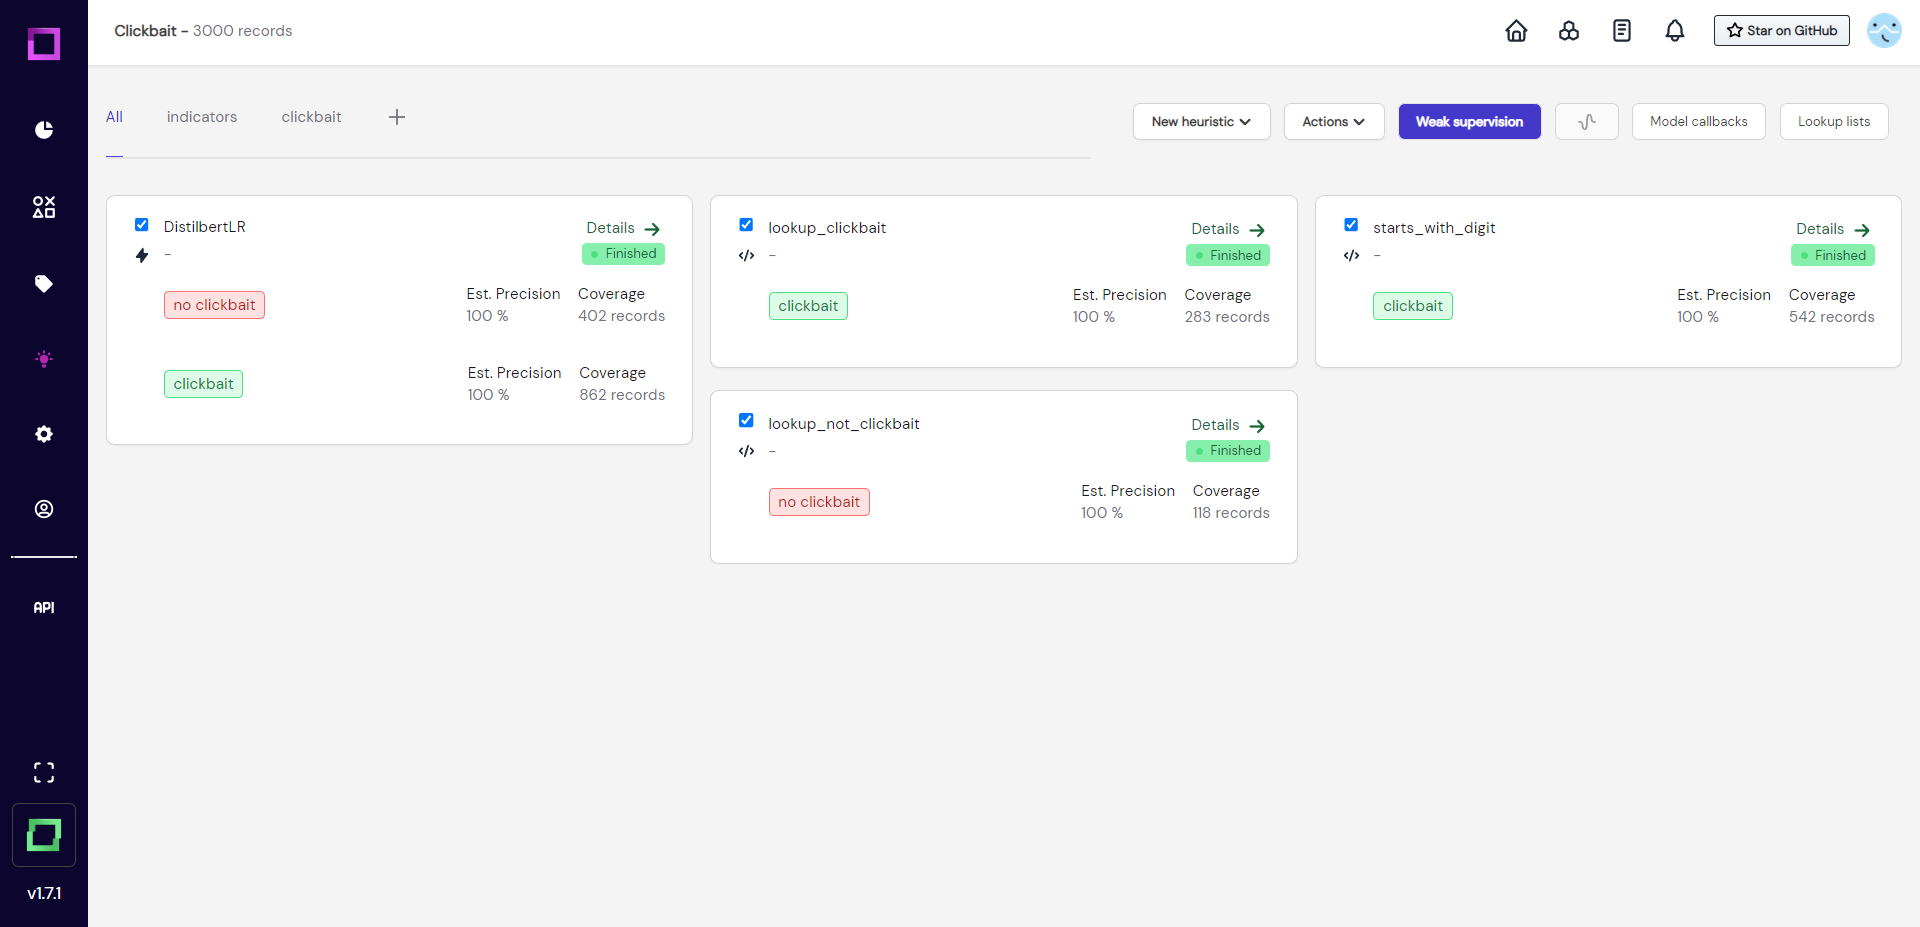
That is why we will first select all heuristics and run them (see Fig. 17) to update them. With the latest run, we can then estimate their quality.
After they all finished their execution (see Fig. 18), we can now see the estimated precision, which is one of the most important metrics for weak supervision. At the moment, they are all very over-confident, which usually is bad and means that we have not labeled enough data or not enough diverse data. We could validate the heuristics by labeling the data that they made predictions on, but for the sake of this quickstart, we will just move on to the weak supervision.
Note: your precision estimations could look a little different depending on what records you have labeled.
To weakly supervise our data, we just select all heuristics that we want to incorporate and click on the colorful button at the top (see Fig. 19).
Evaluation
After we applied weak supervision, we can now revisit the overview page. Click on the pie chart icon at the very top of the navbar. Here you'll see how much data was labeled both manually and through weak supervision (see Fig. 20). You can also see the distributions, which are important as they should roughly match between manual and weakly supervised.
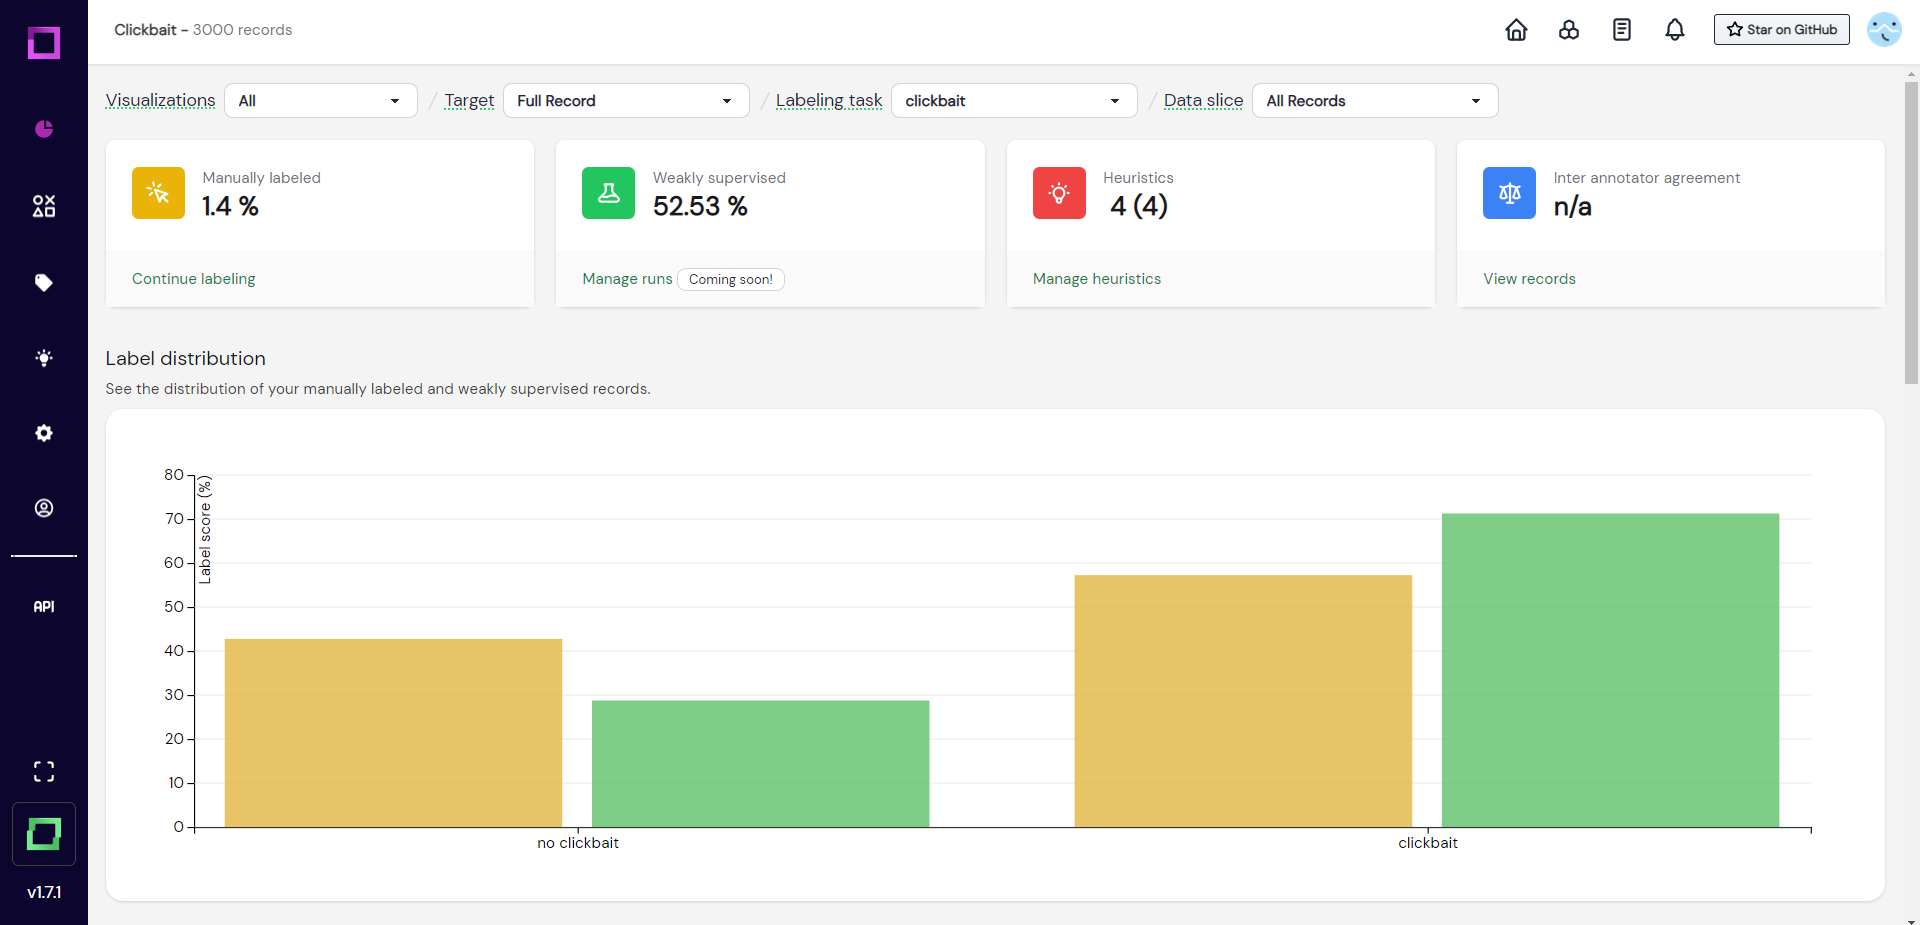
We now have labeled half of the dataset with relatively little effort, which is really awesome. If you scroll down on the overview page, you will see both a confidence distribution chart and a confusion matrix. The confusion matrix is really important to understand the quality of your weakly supervised labels.
Generally, this process only becomes better and better over time as you add more granular heuristics covering a wide spectrum of domain knowledge. Also, it becomes more accurate the more manually labeled reference data you have in your project. You could already export the first version of this data and prototype a classifier to test against some validation data you already have. But instead of doing that, we will show you one last feature that helps in validating your heuristics, which also helps the weak supervision process to figure out which source of information is more correct than others.
Creating a validation data slice
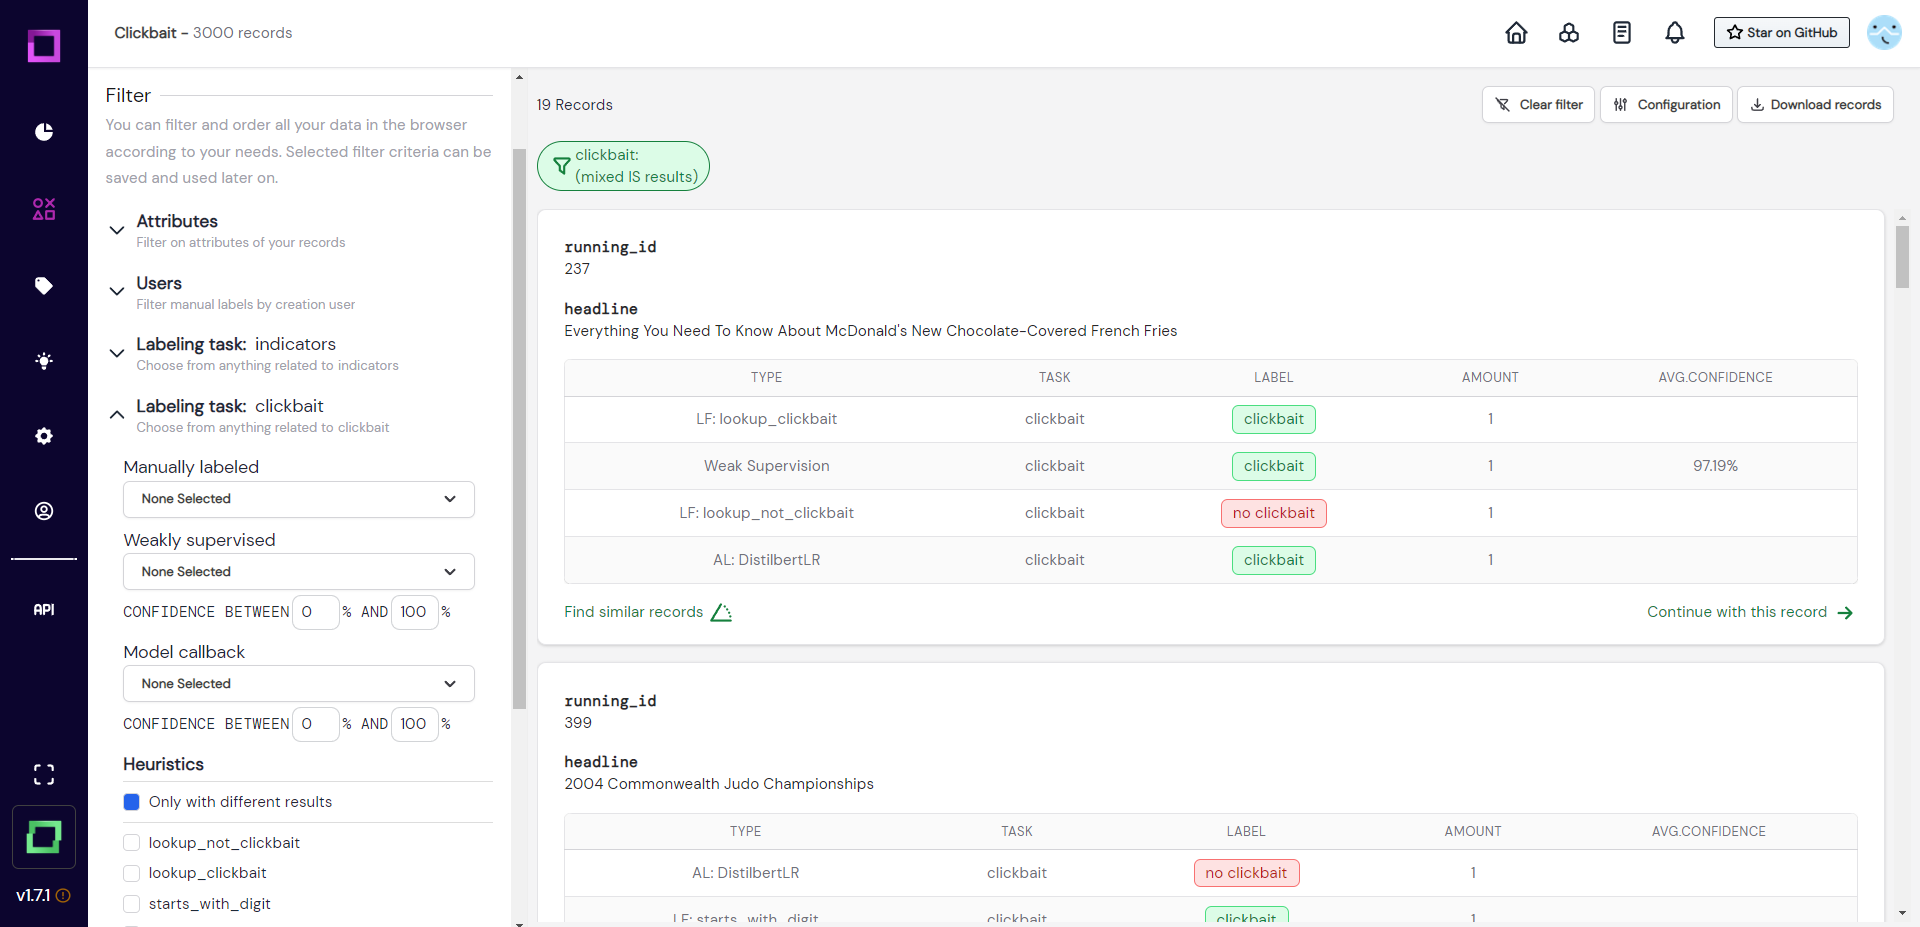
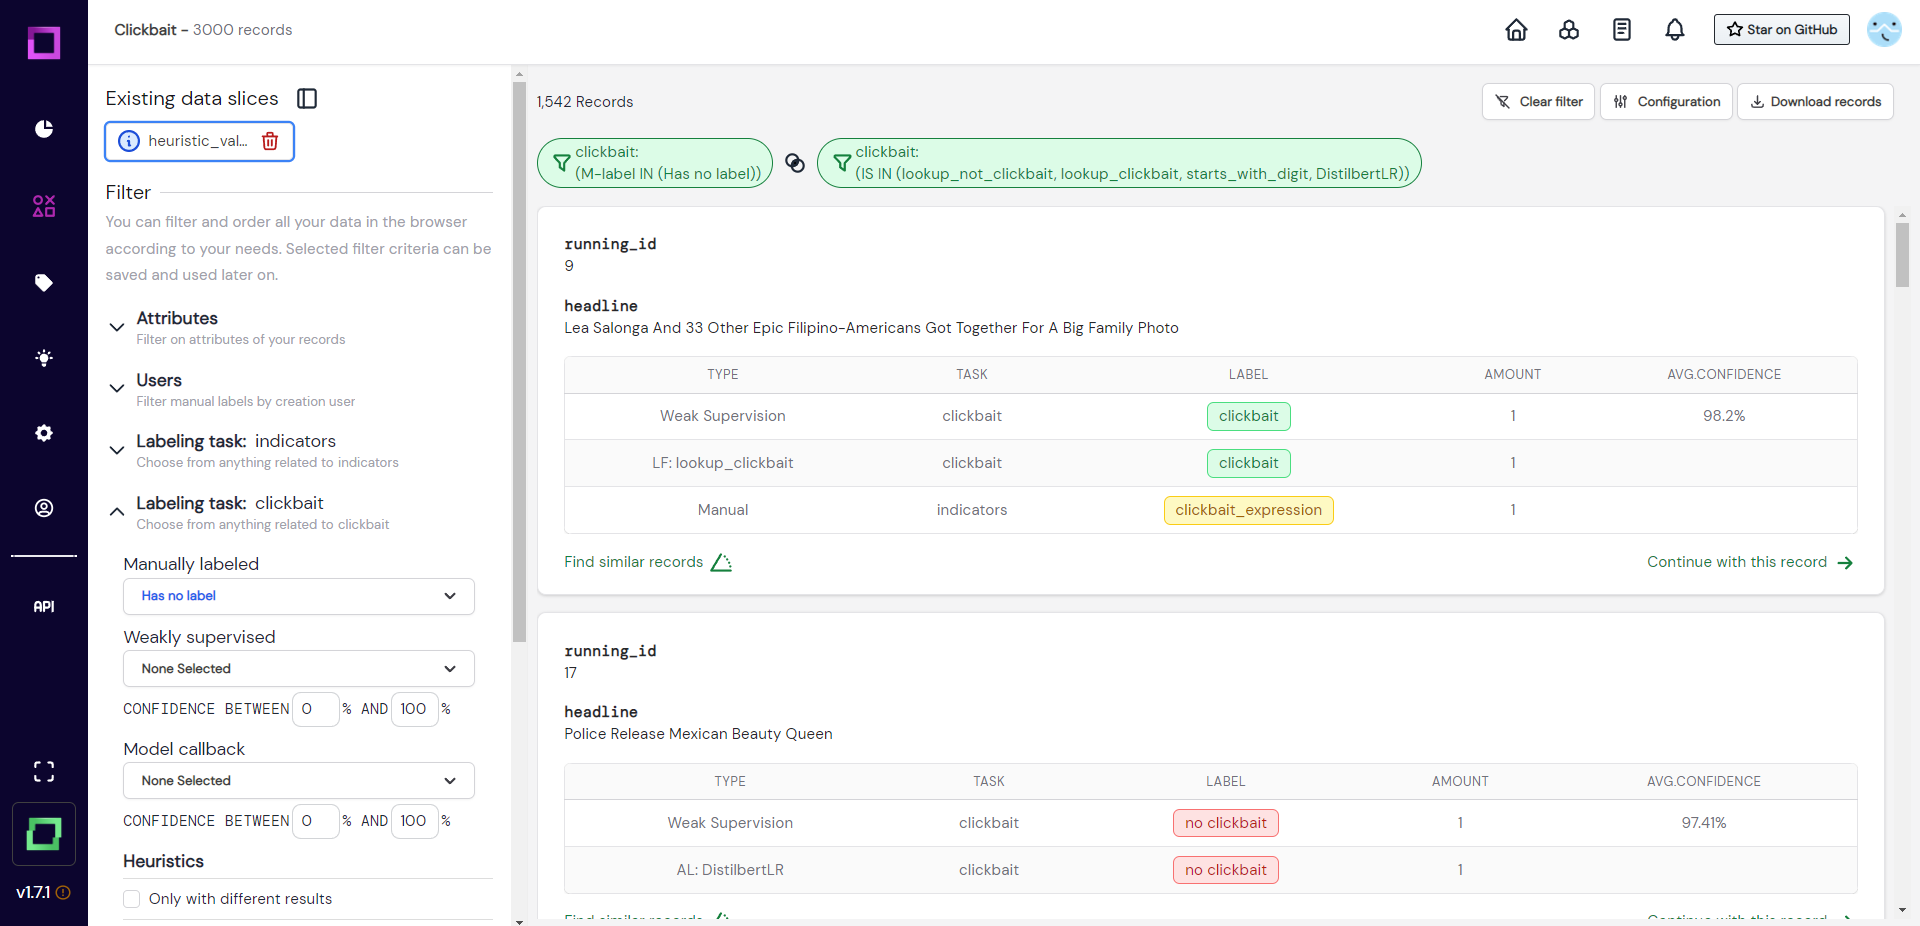
There are many useful filters in the data browser. You could for example specifically filter for records where different heuristics disagree among themselves (see Fig. 21). This is especially powerful to manually correct the over-confidence of certain heuristics.
To validate all heuristics at the same time, we could search for records which the heuristics made a prediction for, but no manual label was yet assigned. To make this validation easily accessible for future sessions, we want to save this filter setting. All of this is done in Fig. 22, where we first filter the data and then save it to a so-called data slice. We chose the dynamic data slice so that every time we use that slice, the filter settings are re-applied to the data. That means after we labeled a little bit of that slice, the labeled data does not fulfill the filter criteria anymore and won't be included the next time we select it - awesome!
If you want to reuse the data slice, just click on it in the data browser and the filter will automatically be reapplied (see Fig. 23).
Optional challenge: create a data slice that consists of records that have a weakly supervised label and no manual label. Sort that data slice by ascending weak supervision confidence.
Exporting the data
You almost reached the end! There is just one final thing to do: export the data. Developing training data with refinery is an iterative process that allows for fast prototyping and constant refinement. There are a lot of ways of exporting your data, for this quickstart we will choose the simplest one: download it as a JSON. For that, go to the settings page and press on "download records" beneath the data schema. You can leave everything on default, press "prepare download" and then download the zip file. Always make sure to press "prepare download" before actually downloading because otherwise, you would download outdated data (we save the last export).
What to do next?
That concludes this quickstart. Thank you so much for staying with us until this point, we hope you enjoyed it :)
If you have any feedback, questions, or just nice words, you can reach us on our community Discord! We would love to have you chatting there. Or, if you wish to show us some github love, you can do that on refinery.
You have now seen large parts of the application and got a feeling for the important workflows. From here, you could grab some data of yours and create a new project with it! Learning by doing is after all the most efficient way to master refinery.
But if you want to stay a little longer in this demo project, here are a few suggestions to further explore refinery:
- Wonder why we renamed the label names at the beginning? Add a zero-shot classifier to the heuristics!
- Improve your weak supervision by validating existing heuristics.
- You're not satisfied with the existing attributes? Use Python code to generate new ones!
- Already got a model for spam detection and want to feed its predictions into refinery? Try model callbacks.
- Want to collaborate with your colleagues? Check our managed version with multi-user labeling capabilities!